Plot parameter uncertainty for probabilistic methods
Source:R/16.3-plot-analysis.R
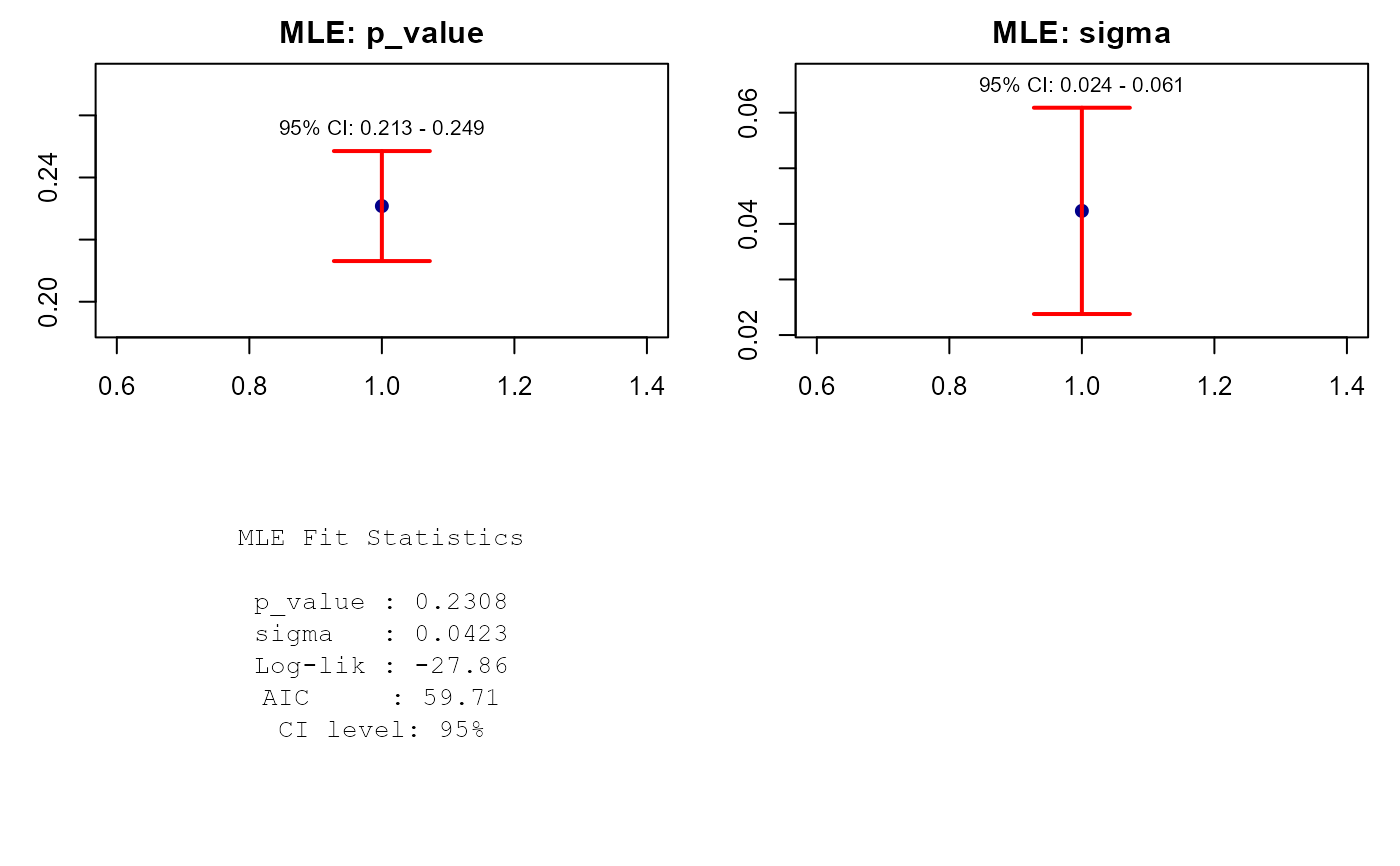
plot_uncertainty.fb4_result.RdCreates plots showing parameter estimates with confidence intervals. Adapts automatically to the method used (MLE, bootstrap, hierarchical).
Usage
plot_uncertainty.fb4_result(
  fb4_result,
  parameters = "all",
  color_scheme = "blue",
  add_ci_text = TRUE
)Examples
# \donttest{
data(fish4_parameters)
sp   <- fish4_parameters[["Oncorhynchus tshawytscha"]]$life_stages$adult
info <- fish4_parameters[["Oncorhynchus tshawytscha"]]$species_info
bio  <- Bioenergetic(
  species_params     = sp,
  species_info       = info,
  environmental_data = list(
    temperature = data.frame(Day = 1:30, Temperature = rep(12, 30))
  ),
  diet_data = list(
    proportions = data.frame(Day = 1:30, Prey1 = 1.0),
    energies    = data.frame(Day = 1:30, Prey1 = 5000),
    prey_names  = "Prey1"
  ),
  simulation_settings = list(initial_weight = 100, duration = 30)
)
#> Bioenergetic object created for: Oncorhynchus tshawytscha
bio$species_params$predator$ED_ini <- 5000
bio$species_params$predator$ED_end <- 5500
set.seed(42)
obs_weights <- rnorm(10, mean = 90, sd = 5)
result_mle <- run_fb4(bio, strategy = "mle", fit_to = "Weight",
                      observed_weights = obs_weights, verbose = FALSE)
#> Validation warnings:
#> Missing optional parameters (will be calculated): CG1, CG2
#> Object is ready for simulation
#> Validation warnings:
#> Missing optional parameters (will be calculated): CG1, CG2
#> Object is ready for simulation
#> Processing species parameters...
#> Processing temporal data...
#> No indigestible fraction data provided, using default 0% for all prey (FB4 default)
#> Processing simulation settings...
#> Simulation data preparation complete. Ready for simulation.
plot_uncertainty.fb4_result(result_mle)

# }
# }