Plot temperature sensitivity analysis for a Bioenergetic object
Source:R/16.3-plot-analysis.R
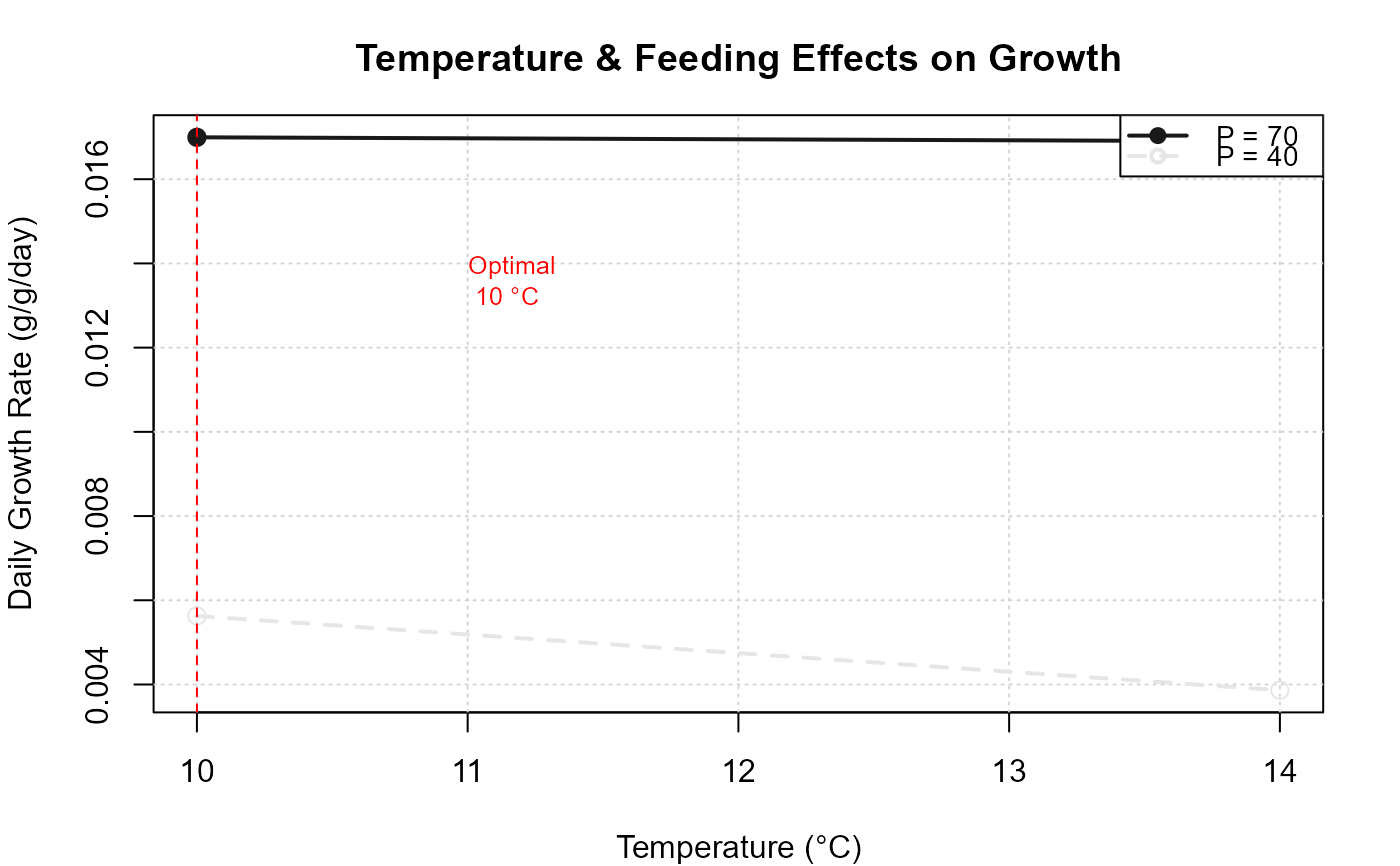
plot_sensitivity.fb4_result.RdRuns analyze_growth_temperature_sensitivity and plots the result.
Sensitivity analysis requires a Bioenergetic object (not an
fb4_result), because it re-runs the model across a grid of
temperatures and p_values. Use plot(bio_obj, type = "sensitivity")
as the primary interface; this function is the underlying implementation.
Arguments
- bio_obj
Bioenergetic object with species parameters, temperature profile, diet, and simulation settings.
- temperatures
Numeric vector of absolute temperatures (°C) to test. Default
seq(4, 20, by = 2).- p_values
Numeric vector of p_values (proportion of Cmax) to evaluate. Must be in (0, 1]. Default
seq(0.3, 1.0, by = 0.1).- simulation_days
Number of simulation days. Default 365.
- color_scheme
Color scheme for the plot. Default
"grayscale".- add_annotations
Add optimal temperature annotations. Default TRUE.
- verbose
Show analysis progress. Default FALSE.
- ...
Additional arguments passed to
plot_growth_temperature_sensitivity().
Examples
# \donttest{
data(fish4_parameters)
sp   <- fish4_parameters[["Oncorhynchus tshawytscha"]]$life_stages$adult
info <- fish4_parameters[["Oncorhynchus tshawytscha"]]$species_info
bio  <- Bioenergetic(
  species_params     = sp,
  species_info       = info,
  environmental_data = list(
    temperature = data.frame(Day = 1:30, Temperature = rep(12, 30))
  ),
  diet_data = list(
    proportions = data.frame(Day = 1:30, Prey1 = 1.0),
    energies    = data.frame(Day = 1:30, Prey1 = 5000),
    prey_names  = "Prey1"
  ),
  simulation_settings = list(initial_weight = 100, duration = 30)
)
#> Bioenergetic object created for: Oncorhynchus tshawytscha
bio$species_params$predator$ED_ini <- 5000
bio$species_params$predator$ED_end <- 5500
plot_sensitivity.fb4_result(
  bio_obj         = bio,
  temperatures    = c(10, 14),
  p_values        = c(0.4, 0.7),
  simulation_days = 30,
  verbose         = FALSE
)
#> Processing species parameters...
#> Processing temporal data...
#> No indigestible fraction data provided, using default 0% for all prey (FB4 default)
#> Processing simulation settings...
#> Simulation data preparation complete. Ready for simulation.

# }
# }