About this project
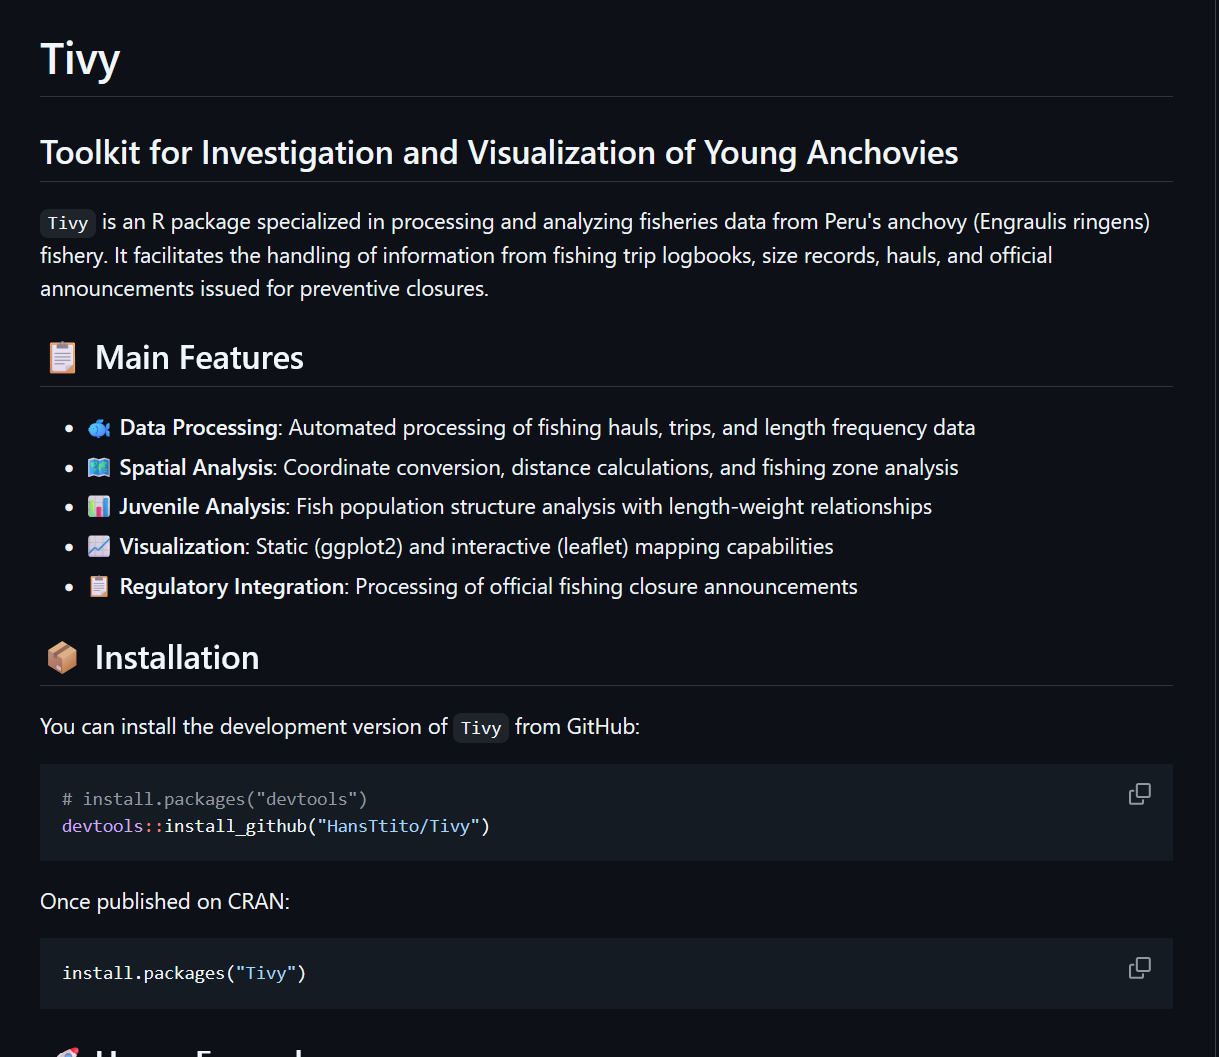
Tivy (Toolkit for Investigation and Visualization of Young Anchovies) is an R package specialized in processing and analyzing fisheries data from Peru’s anchovy (Engraulis ringens) fishery. It facilitates the handling of information from fishing trip logbooks, length frequency records, haul data, and official announcements issued by Peru’s Ministry of Production for preventive closures.

Main Features
- 🐟 Data Processing: Automated processing of fishing hauls, trips, and length frequency data
- 🗺️ Spatial Analysis: Coordinate conversion, distance calculations, and fishing zone analysis
- 📊 Juvenile Analysis: Fish population structure analysis with length-weight relationships
- 📈 Visualization: Static (ggplot2) and interactive (leaflet) mapping capabilities
- 📋 Regulatory Integration: Processing of official fishing closure announcements from PRODUCE
Key Capabilities
- Biological Indicators: Calculate juvenile percentages, length-weight relationships, and population metrics
- Spatial Tools: Convert DMS coordinates, calculate distances to coast, and analyze fishing zones
- Data Integration: Merge logbook data from multiple sources with automated column detection
- Regulatory Analysis: Process PDF announcements and visualize fishing closure areas
- Comprehensive Visualization: Create publication-ready plots and interactive dashboards
Target Users
- Fisheries Researchers: Analyzing anchovy population dynamics and recruitment
- Resource Managers: Monitoring fishing activities and regulatory compliance
- Data Analysts: Processing large-scale fishery datasets from Peru
- Students: Learning fisheries data analysis and visualization techniques
How to access
The package is available on GitHub with comprehensive documentation and examples.
# Install from GitHub
devtools::install_github("HansTtito/Tivy")

# Load and start analyzing
library(Tivy)
Soon to be available on CRAN for easier installation.
Learn More
- 📖 Package Documentation
- 🐛 Report Issues
- 📧 Contact: kvttitos@gmail.com